# Using this reponsitory to realize 3 functions:
1. Generate a MODEL to evaluate stereochemical quality of a given protein structure (with coordinates);
2. Using interacted plot to view distribution of phi and psi of a single protein, a chain even a residue, or more;
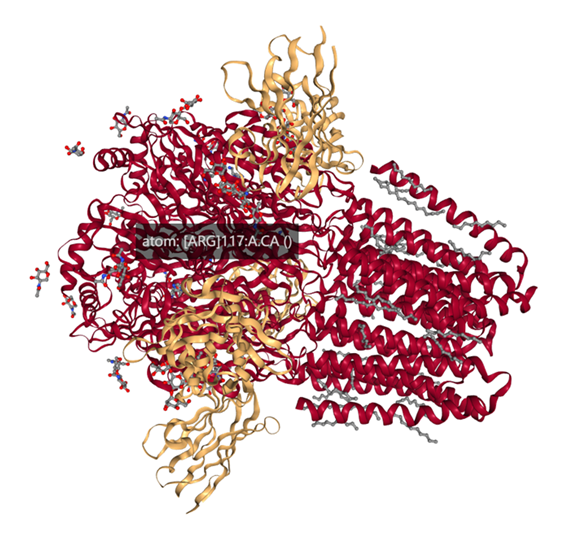
3. 3D structure of the choosed .pdb file
See details in 合并df.zip
data cleaning and merge.
Verify the data with Biopython output.

See details in code_for_RAMA_plot.ipynb
References: Morris AL, MacArthur MW, Hutchinson EG, Thornton JM. Stereochemical quality of protein structure coordinates. Proteins. 1992;12(4):345-364.
TOTAL WORKFLOW
Data process 1:

Data process 2 (improved methods):

The plot show the phi and psi based on above total dataframe from pre-processing

see details at https://github.com/nglviewer/nglview