A Software for Identification and Characterization of Dominant Rhythm in Neural Time Series (e.g., EEG, LFP)
If you use this software in your research, please cite it as follows:
N. Bahador, S. Sengupta, J. Saha, M. Lankarany, L. Zhang, F. Skinner (2024). A Software for Identification and Characterization of Theta Rhythms in the Hippocampus.
- Launch the MATLAB App and wait for the App Designer window to appear.
- Click on the "Run" button to open the user interface.
- Place the "fieldtrip-master" folder and the "abfload.m" script in the same directory as the NeuroDominanceTracker GUI executable.
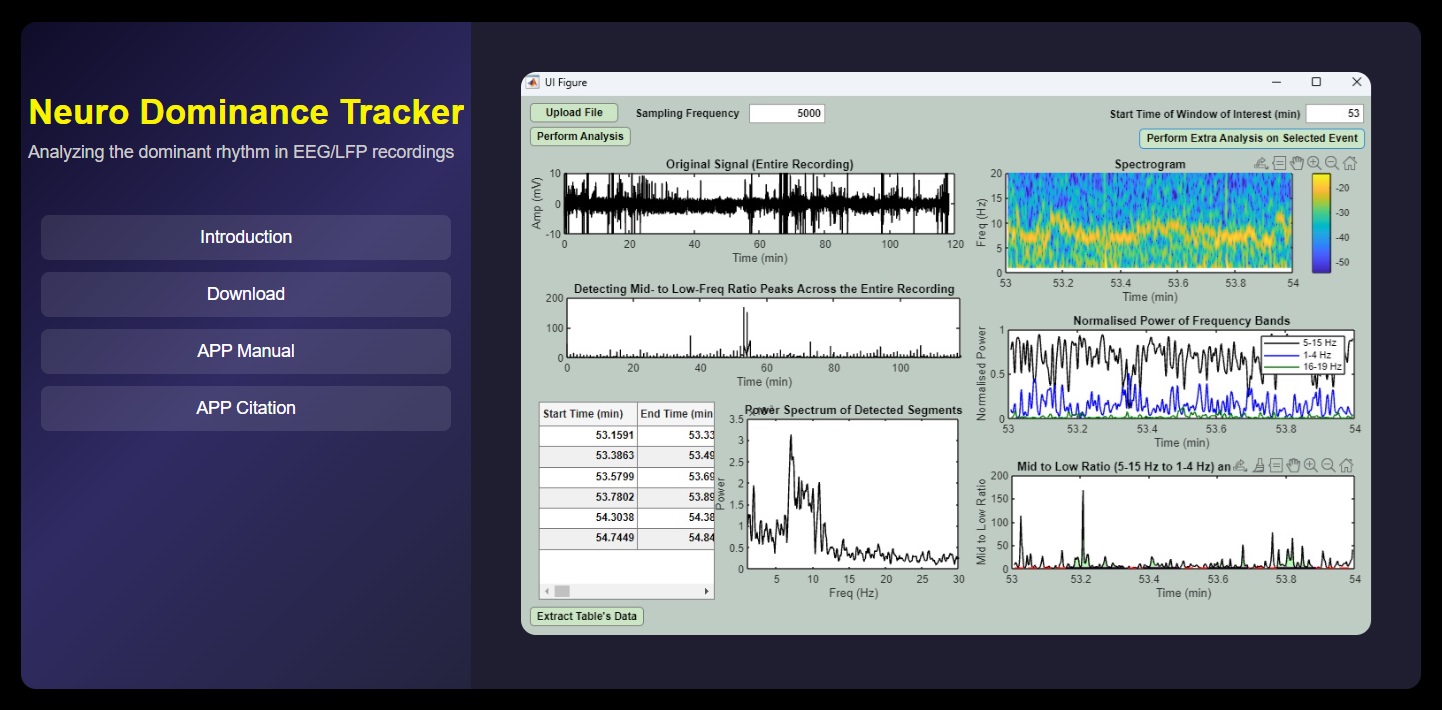
- Upload your file.
- Enter the sampling frequency (e.g., 5000 Hz).
- Click on the "Perform Analysis" button.
- The app will analyze the recording in one-minute windows.
- Messages will appear in the MATLAB command window for each window analyzed, indicating if a dominant mid-frequency is observed.
- Wait for all windows to be analyzed (e.g., 118 windows for a sample two-hour recording).
- Once analysis is complete, a table listing all identified episodes and their characteristics will be displayed.
- You can extract this table as an Excel sheet by clicking the appropriate button.
- Select an event and enter its corresponding minute (e.g., 109).
- Click the button to visualize the selected event.
- A spectrogram of the one-minute segment starting from the selected minute will be plotted.
- The normalized power of mid, low, and high-frequency bands over time will be shown.
- Dominant mid-frequency segments will be highlighted in green.
- The power spectrum of the first dominant mid-frequency segment will be plotted.
- Click the button to save the features as an Excel file.
The sample EDF (European Data Format) files used in this project were obtained from the following publication:
Brown, L. A., Hasan, S., Foster, R. G., & Peirson, S. N. (2016). The raw EEG data, 4 files (EEG_A to D), in European data format (.edf) [Data set]. Zenodo.
Available at: https://doi.org/10.5281/zenodo.160118
Direct access to the data can be found here: Zenodo Record.
This project leverages the FieldTrip toolbox to support different file formats, including FIF, EDF, and BDF.
Reference:
Oostenveld, R., Fries, P., Maris, E., & Schoffelen, J.-M. (2011). FieldTrip: Open Source Software for Advanced Analysis of MEG, EEG, and Invasive Electrophysiological Data. Computational Intelligence and Neuroscience, 2011, 156869.
You can access the FieldTrip toolbox here: https://www.fieldtriptoolbox.org/.