The Patient Dashboard Application is a React-based web application built using Next.js, Vite, and Tailwind CSS. It provides a comprehensive dashboard to view and manage patient data, including a blood pressure chart and detailed diagnosis history. The application leverages various libraries such as Chart.js, @headlessui/react, and Redux Toolkit for state management.
- Patient List: View a list of patients with their basic details.
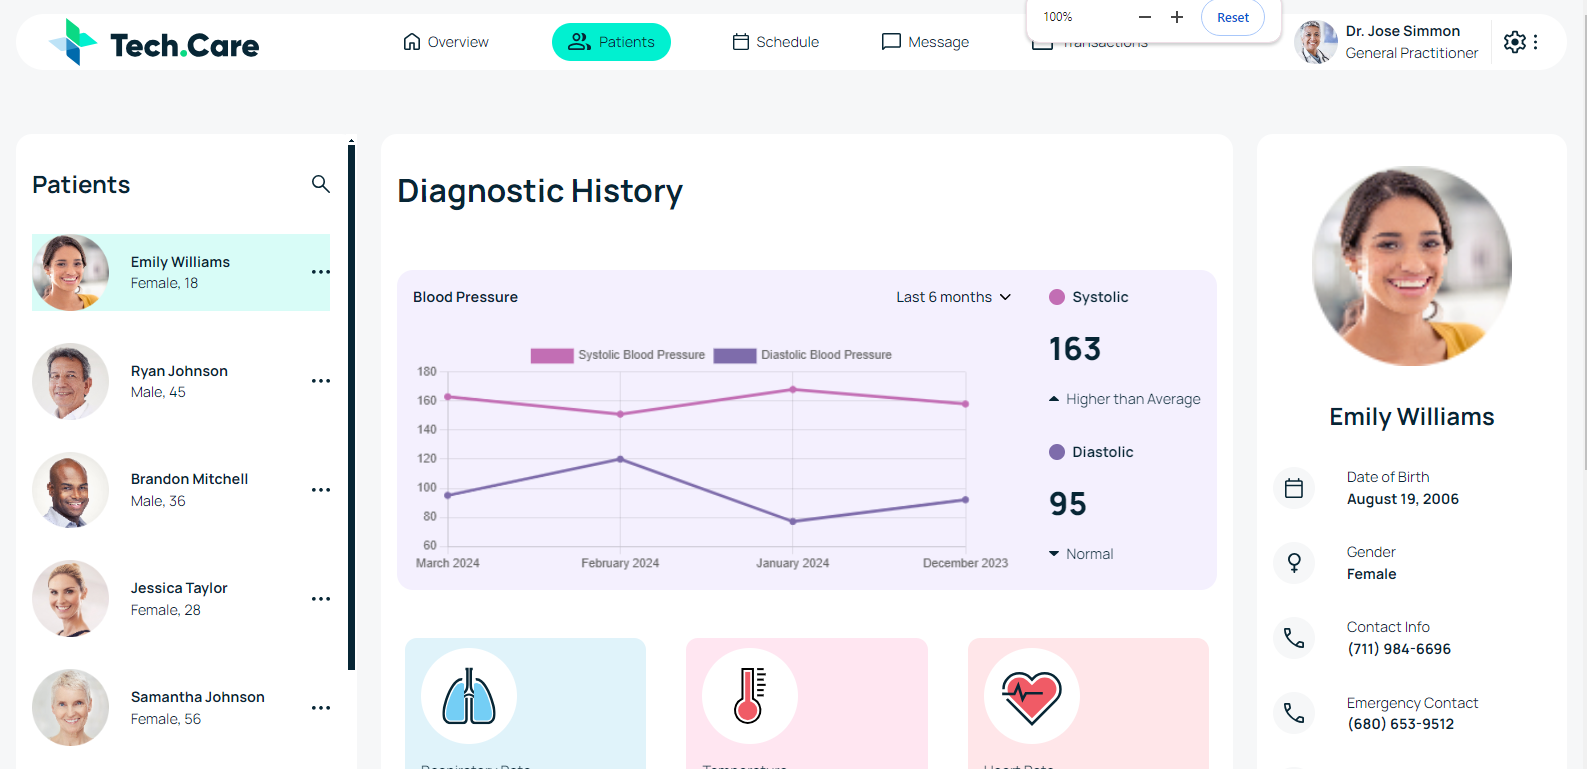
- Patient Details: Click on a patient to view detailed diagnosis history and blood pressure charts.
- Blood Pressure Chart: Visualize the blood pressure trends of the selected patient over the last six months.
- Responsive Design: The application is fully responsive and works well on all devices.
- React
- Next.js
- Vite
- Tailwind CSS
- Chart.js
- @headlessui/react
- Redux Toolkit
- Express
- MongoDB
-
Clone the repository:
git clone https://github.com/yourusername/patient-dashboard.git
-
Navigate to the project directory:
cd patient-dashboard -
Install the dependencies:
npm install
-
Start the development server and open it in the browser:
npm run dev
http://localhost:3000
- The sidebar lists all patients fetched from the backend.
- Click on a patient to view their details, including diagnosis history and blood pressure charts.
-
When a patient is selected, their blood pressure data over the last six months is displayed in a line chart.
-
The chart is rendered using Chart.js.


- Fork the repository.
- Create a new branch (git checkout -b feature/your-feature-name).
- Commit your changes (git commit -am 'Add some feature').
- Push to the branch (git push origin feature/your-feature-name).
- Create a new Pull Request.
This project is licensed under the MIT License. See the LICENSE file for details.
Contact For any inquiries or issues, please contact Me.